

From commerce signals to measurable growth
A glimpse of our MMM Conceptualization
The Analytics & Intelligence Platform for Retail and Ecommerce
Trailytics transforms fragmented commerce data into AI-powered intelligence, enabling brands to improve discoverability, availability, conversion, profitability, and long-term growth.
Purpose-Built Intelligence for Every Stage of the Commerce Journey
Every commerce function generates valuable insights, but disconnected tools create disconnected decisions. Trailytics delivers specialized AI products for each stage of the commerce journey, helping brands connect insights, optimize execution, and accelerate growth.
One measurement system, built on three connected layers
Incrementality testing, marketing mix modeling, and attribution correction work together as one always-on system — each layer continuously strengthening the accuracy of the others.
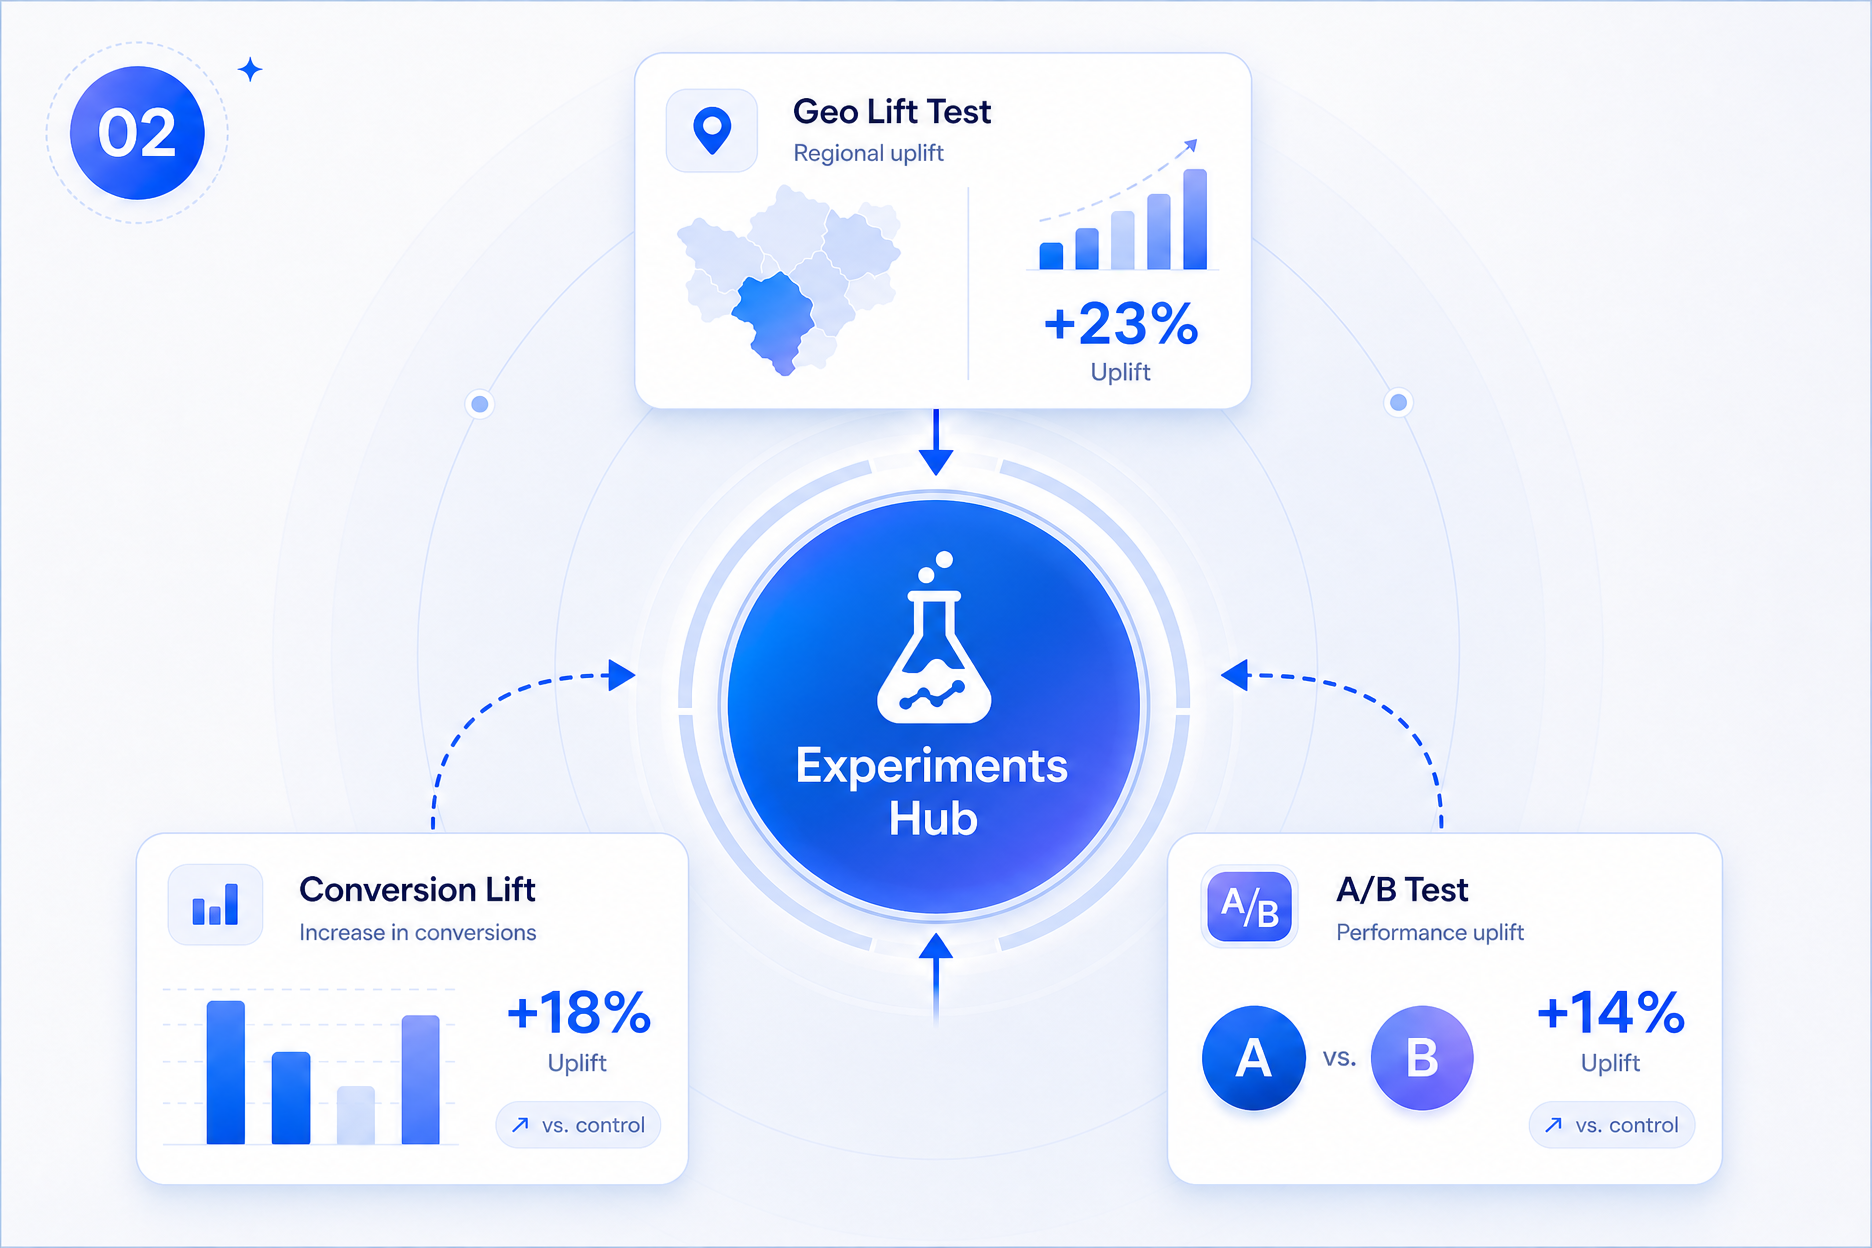
Geo Lift tests, Conversion Lift studies, and A/B experiments are brought together in a centralized experimentation framework. This establishes reliable causal evidence, with every test continuously strengthening future measurement accuracy and optimization decisions.

An always-on Causal Bayesian MMM combines media, sales, promotions, and external factors to uncover the true drivers of business performance. By filling the gaps that experiments cannot cover, it continuously measures incremental impact and guides smarter investment decisions across channels.
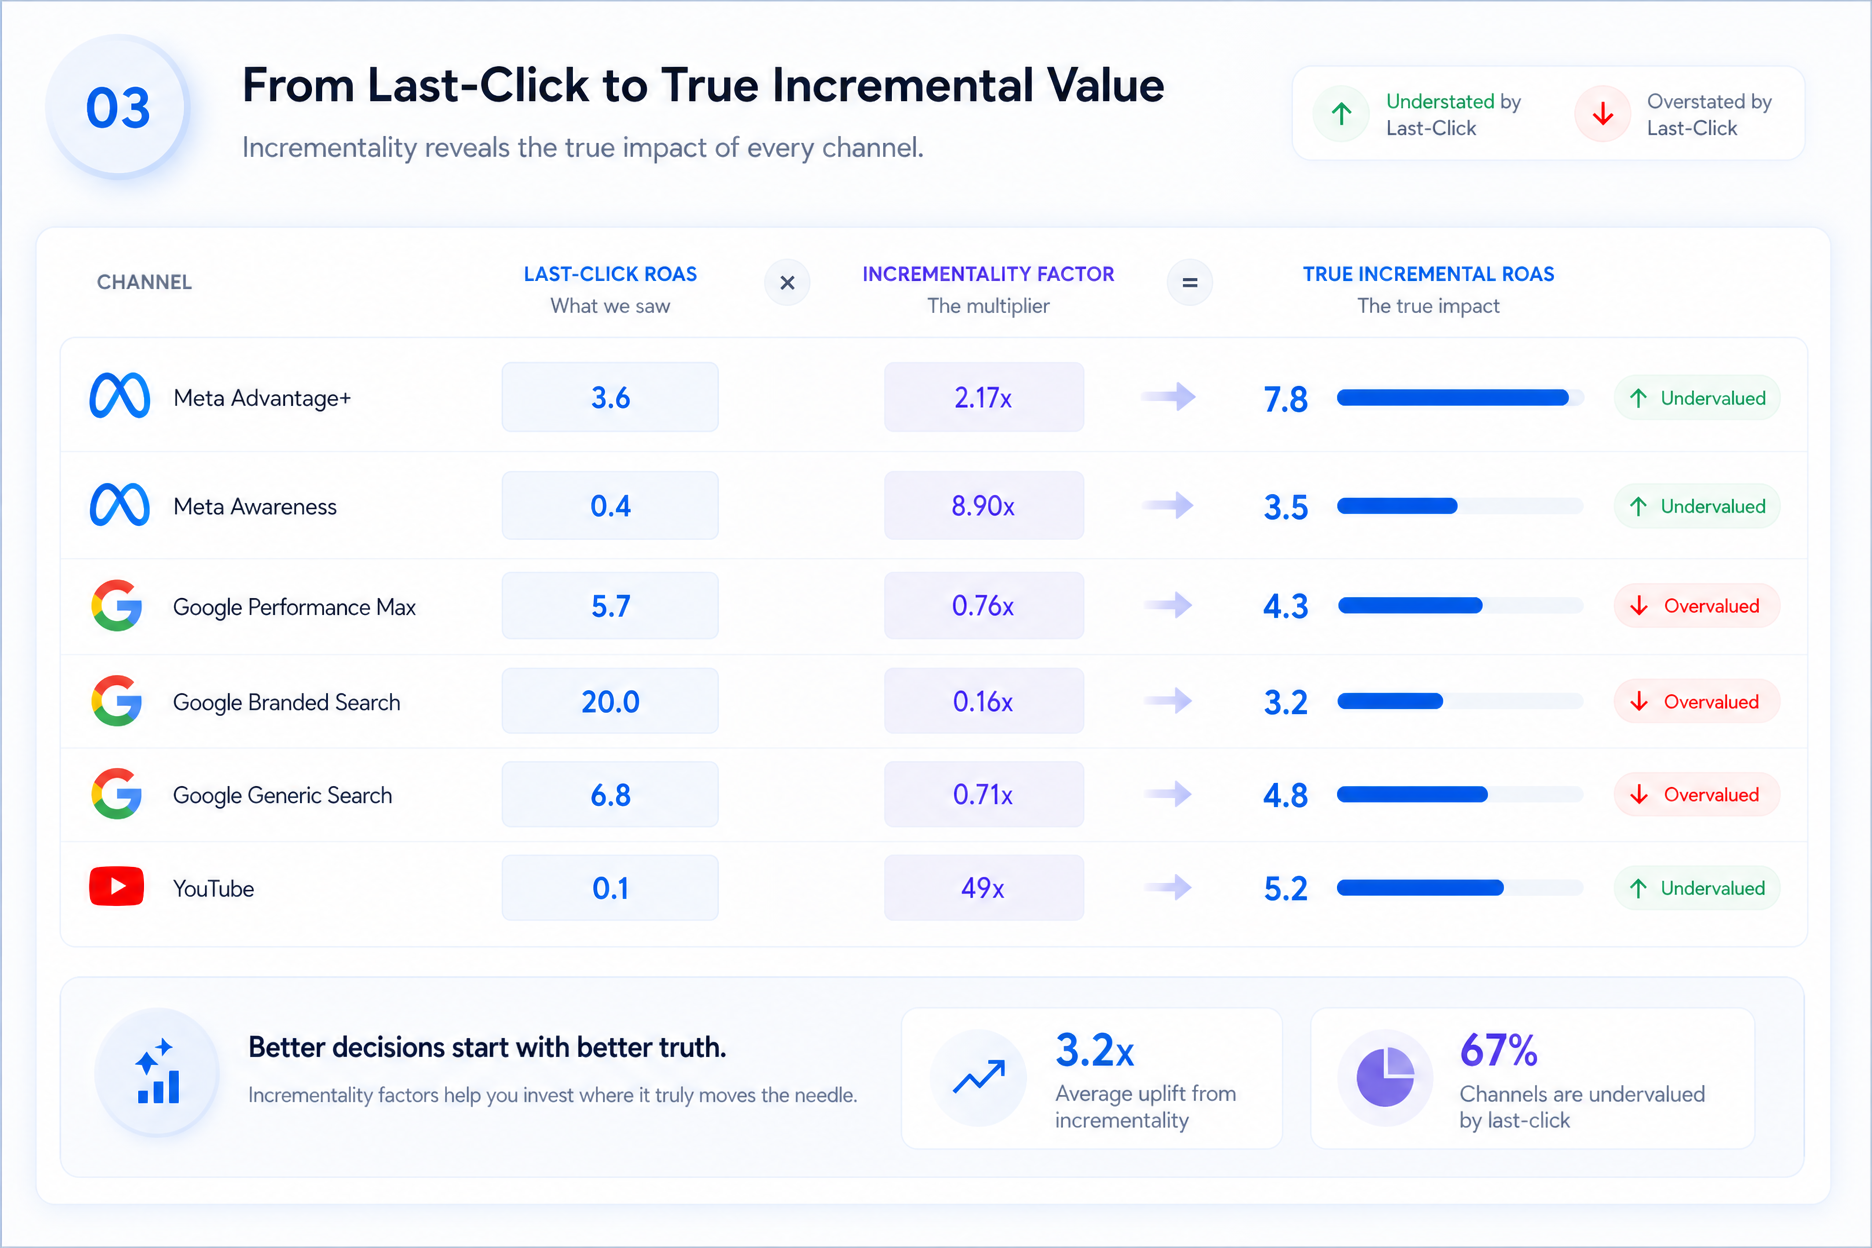
Attribution is continuously refined using calibration factors derived from Marketing Mix Modeling and controlled experiments. This provides a more accurate view of channel contribution, enabling better campaign optimization and more reliable measurement of incremental ROAS at both the campaign and ad-set level.
How Trailytics powers the connected commerce journey
Trailytics transforms fragmented commerce signals into connected intelligence — helping brands analyze performance, optimize decisions, execute with confidence, measure business impact, and continuously accelerate growth across every stage of the commerce journey.
Move ₹86.7K from Blinkit – Unmapped / Unknown (2.37x) → Instamart – Unmapped / Unknown (8.49x) — est. +₹5.30L ad-GMV.
Weakest channel: Instamart at 8.49x ROAS — its conversion rate lags peers most. Full reallocation ≈ 10.35% blended ROAS (directional).
9.85x
High Spend
Keep scaling
Low Spend
Monitor
High Spend
Fix or cut
Top 4 quick-commerce platforms (Blinkit, Instamart, BigBasket, Zepto) deliver superior ROAS (8.04x–9.57x) on low spend — scale investment. Lower-ROAS channels, especially OTT, Meta, and Influencer, need optimization or budget reallocation.
Reallocating ₹86.7K unlocks an estimated +₹5.30L ad-GMV uplift.